
Remain Patient
Market Strategy
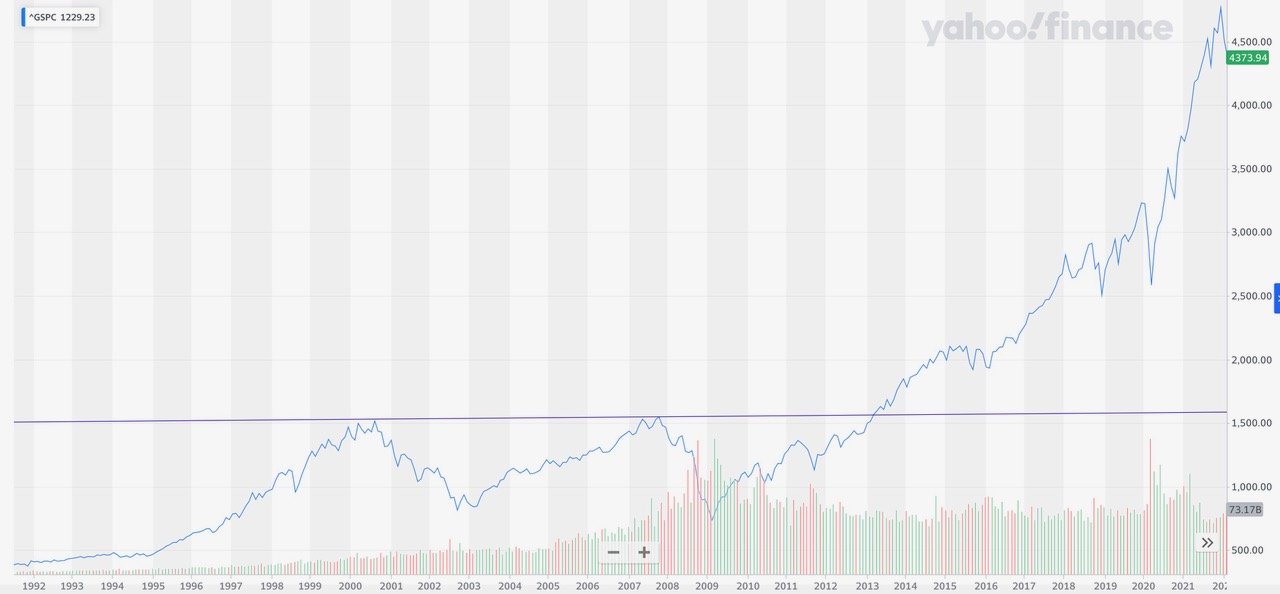
This graph shows that, in August 2000, October 2007, and February 2013, the S&P 500 reached 1515, representing a 12+ year period of no growth.
This graph attempts to allow for the slow-growth period following 2009, the manic years following 2016, and now points to 3250 as the fair value of the S&P 500 in 2022.

The direction of the market in 2023 will, as always, depend on the earnings in 2024 and beyond. Where to invest during periods of slow economic growth can be guided by history. Going back to our first chart, the slower growth period between 2007 and 2013 looks a great deal like what may occur between 2023 to 2029.

This final graph shows the S&P 500 provided 4.08% growth between 2007 and 2013, the 6-year period of slow growth, while the NASDQ provided moderate growth of 28.33%.
Our current market strategy is to remain in the highest quality equities and short-term fixed income securities during the next several months. We estimate that today the S&P 500 resembles the black dotted line as represented on this graph and we are quickly approaching a market bottom.
Soon there will be a time to increase exposure to the stocks that will recover more quickly and provide outstanding results in the years to come: Technology, Artificial Intelligence, 5G, Biotech, Electric Vehicles, Alternative Fuels… the companies that will drive world-wide productivity for decades to come. We plan to lock in higher yields as they become available.
While these stocks were priced as though all the possible positive events had already occurred, they are quickly approaching values representing all possible negative events, and will represent excellent values.
Remain patient. This, too, shall pass.
Mark J. Seski
Chief Investment Officer